
Survey on Accessibility for Visually-Impaired People Using E-Commerce in Japan
Mercari R4D (“R4D”), the research and development arm of Mercari, Inc. (“Mercari”), and Pixie Dust Technologies, Inc. (“PXDT”), a company using technologies developed in academic circles to solve real social issues, have begun research and development of inclusive design*1 for e-commerce products to enable anyone to use these services, even with differing levels of disability.
As part of this collaborative research, R4D and PXDT conducted a web-based survey regarding use of online shopping, targeting visually-impaired users in Japan and their caregivers. In this way, the companies hope to better define the challenges facing users with visual disabilities.
Background
In the ever-changing digital world of today, our access to information is limited by factors such as race, ethnicity, gender, and socio-economic standing. Many efforts to address accessibility issues in digital consumer products apply their solutions after the fact, with most applications primarily designed for users of commercially and practically viable age, without concern for disability.
Mercari’s proprietary C2C marketplace app boasts a wide variety of users who have signed up for the service since its founding. In recent years, the number of Mercari users in their 60s or older has also been increasing.*2 Mercari is currently working to define and test the issues which users of advanced age or visual impairment face in their interactions with Mercari’s C2C marketplace (that is, the interplay between these users and the system). Through this, Mercari aims to propose guidelines for e-commerce accessibility, as well as design and develop accessible e-commerce products.
PXDT is part of the xDiversity Project, which works to help people overcome physical difficulties or disabilities and solve the social issues these disabilities entail. PXDT has developed tactile and visual devices to allow people with listening impairments to enjoy music and automated wheelchairs allowing wheelchair users to go where they want, when they want. In this way, they have worked to achieve a sustainable, diverse society through technology. It was this background that led R4D and PXDT to launch this collaborative research project.
*1 Method for developing products which are accessible and can be used by a wide variety of persons, incorporating the diverse needs of people of advanced age and people with disabilities into the product from the design phase.
Survey Overview
Survey Period: July 20, 2020 – September 22, 2020
Survey Method: Web-based survey (text-to-speech)
Target: 133 men and women in Japan aged 15–76
Summary of Survey Results
1) Frequency of online shopping
The results showed that among the target group, nearly 90% of those with no eyesight or weak eyesight shop online “occasionally,” “often,” or “always.” They also showed that only 7% of those with no eyesight and only 4% of those with weak eyesight never shop online. Note that this data only represents those who purchase online, rather than those who sell.

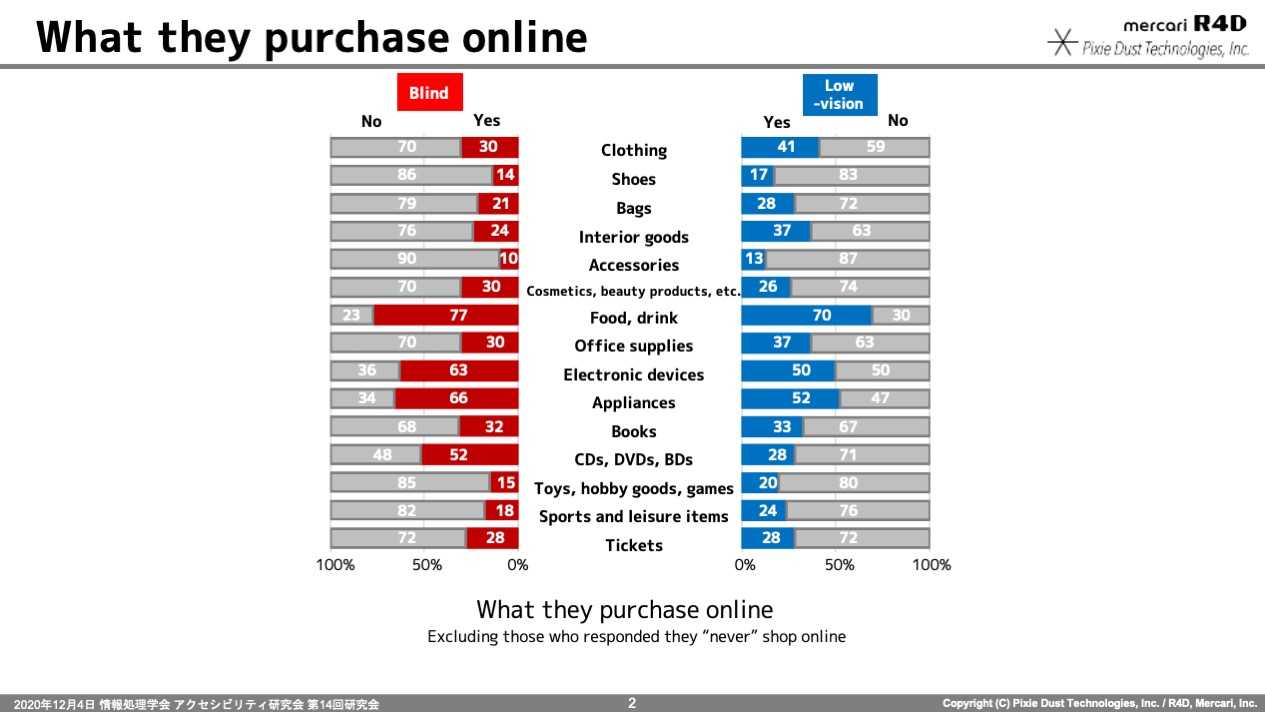
2) What they purchase online
Both those with no eyesight and those with weak eyesight purchase food and drinks online the most (77% of those with no eyesight and 70% of those with weak eyesight). The next most common categories were electronic devices (63%, 50%) and appliances (66%, 52%). On the other hand, few purchased clothes (30%, 41%), interior items (24%, 37%), or accessories (10%, 13%).
3) Devices used and difficulties encountered when shopping online
Both those with no eyesight and those with weak eyesight said that they use their PC for shopping online (no eyesight: “always” = 29%, “often” = 32%; weak eyesight: “always” = 24%; “often” = 22%).
When it comes to tablet computers, 7% of those with no eyesight said they “always” use a tablet browser, while 6% said they “often” use one. Meanwhile, 6% said they “always” use a table app, and 6% said they “often” do. Among those with weak eyesight, 15% “always” use a tablet browser and 11% “often” use one. Similarly, 9% “always” use a tablet app, and 14% “often” use one. These results seem to indicate that fewer people with no eyesight use a tablet than people with weak eyesight.
Additionally, with regards to smartphone usage, 14% of those with no eyesight said they use a smart phone browser “always” and 16% said “often.” Meanwhile, 20% said they “always” use smartphone apps and 25% said they “often” do. Responses from those with weak eyesight totaled 9%, 22%, 9%, and 18%, respectively.
Although smart speakers have found some use among these groups, they are not ubiquitous, with 78% of those with no eyesight and 83% of those with weak eyesight saying they never use a smart speaker.
The next responses once again revealed that both those with no eyesight and those with weak eyesight experienced the greatest difficulty in understanding “explanation of individual images” (total of “always” and “often” responses: no eyesight = 77%; weak eyesight = 65%), “item quality” (76%, 76%), “clothing size and shape” (83%, 72%), and “design and pattern” (60%, 70%). Conversely, difficulties with “purchasing method” (20%, 24%) were comparatively few, showing us that the issue is not device operation, but rather obtaining item information provided by the selling site.

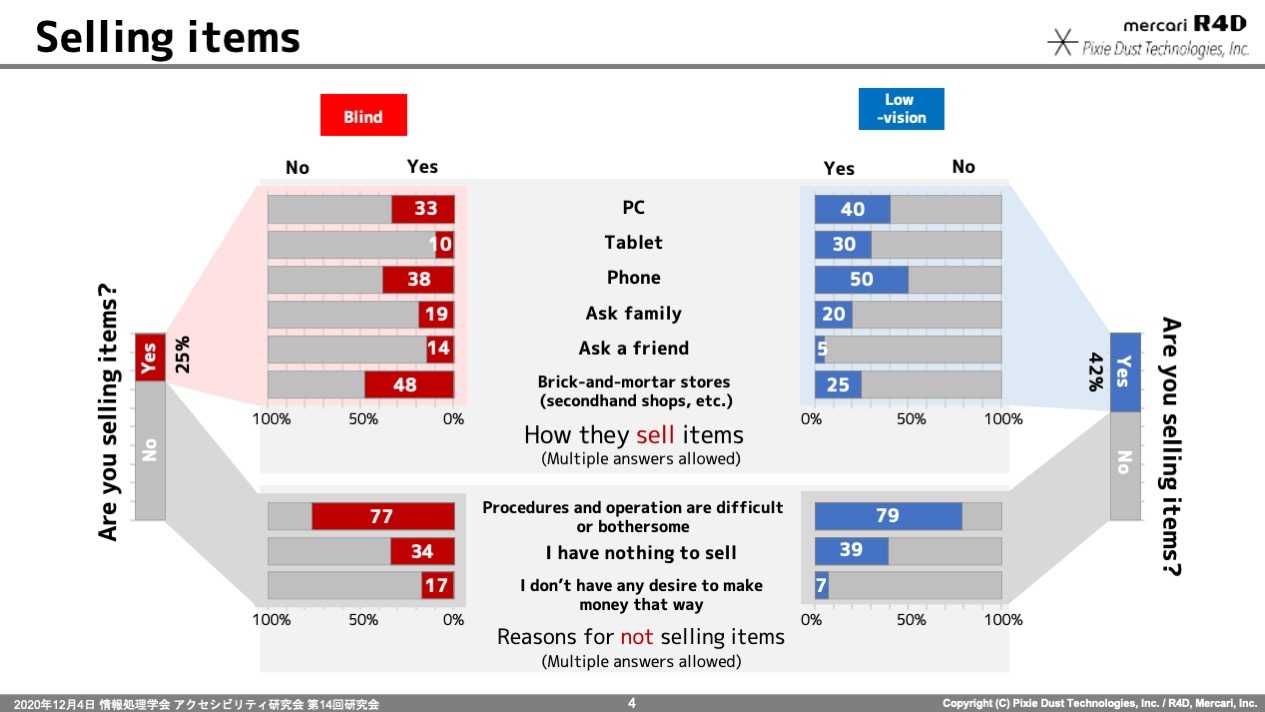
4) Selling items
This survey asked questions about the selling side as well, including both online marketplaces and auction sites. Only 25% of those with no eyesight and 42% of those with weak eyesight sell items online.
Those that do sell were asked about how they sell items. Most of those without eyesight said they sell to “second-hand shops and other brick-and-mortar stores” (48%, or 12% of all respondents). Second to this was selling on smartphone (38%, 9%) and PC (33%, 8%). Most of those with weak eyesight sell their items via smartphone (50%, or 21% of all respondents), followed by PC (40%, 17%), tablet (30%, 13%), and finally, “second-hand shops and other brick-and-mortar stores” (25%, 10%).
Although fewer of those with no eyesight sell or list their items than those with weak eyesight, the percentage of both no-eyesight and weak-eyesight respondents who use “brick-and-mortar stores” is about the same—only around 10% of the total, including respondents who don’t sell. While this data demonstrates that those with no eyesight can use brick-and-mortar stores where they can sell face-to-face, directly to the store, it also shows that they are careful about selling or listing using IT devices due to difficulties or worries associated with those methods.
Among those that do not sell, a whopping 80% or so responded that they did not sell because “procedures and operation are difficult or bothersome.” Conversely, “I have nothing to sell” (34%, 39%) and “I don’t have any desire to make money that way” (17%, 7%) responses were extremely few, indicating that both those with no eyesight and those with weak eyesight would want to sell or list their items if selling/listing procedures and operation were easier.
Mercari and PXDT want to create a world where anyone—of any age, culture, or physical condition—can enjoy using their technology and services. Going forward, these companies will focus on issues like accessibility and universal design in researching meaningful and exciting systems which users of any capability can use, in order to raise, inspire, and create new value for their digital products.
They will continue to conduct surveys and R&D based on the results of this survey, to propose e-commerce accessibility guidelines and help design and develop more accessible e-commerce products.
The details of this survey have also been presented under the title of “Status of and Trends in Accessibility for Visually-Impaired Users of E-commerce Services” at the Information Processing Society of Japan’s 14th Accessible & Assistive Computing Conference.
*3 “Status of and Trends in Accessibility for Visually-Impaired Users of E-commerce Services,” Information Processing Society of Japan’s Research Journal, Vol.2020-AAC-14, No.3, pp.1-8 (2020). (Only available in Japanese)
About Mercari R4D
Mercari R4D was established in December 2017 as a research and development organization aiming to implement its findings into society. R4D stands for Research and 4 D’s: Design, Development, Deployment, and Disruption. R4D aims to create future innovation for the Mercari Group’s services and businesses centered on the core concept of changing value exchange through technology. It conducts research and development focusing on technologies such as AI, blockchain, HCI (human-computer interaction), quantum computing, and mobility.
Website: https://r4d.mercari.com
For any inquiries regarding this research, please contact us through R4D’s website.